Bespoke Web Data Visualizations
Over the last decade there has been a growing number of tools to try to make sense of the explosion of data being generated. Techniques using spreadsheets like Excel and Google Sheets or enterprise tools such as Tableau and Microsoft Power BI help convert data and analyze results. More complex methods use Juypter notebooks to create dataframes using Python libraries such as Pandas and Numpy. All these techniques have the potential to inform and drive business objectives.
Why data visualization?
Compeling visuals instill curiosity and potentially draw in more clients to further explore your services. A picture paints a thousand words and a good visualization reinforces your brand by demonstrating scientific and analytical rigor.
What are your options?
There are several approaches to help visualize your data and each approach has advantages and challenges:

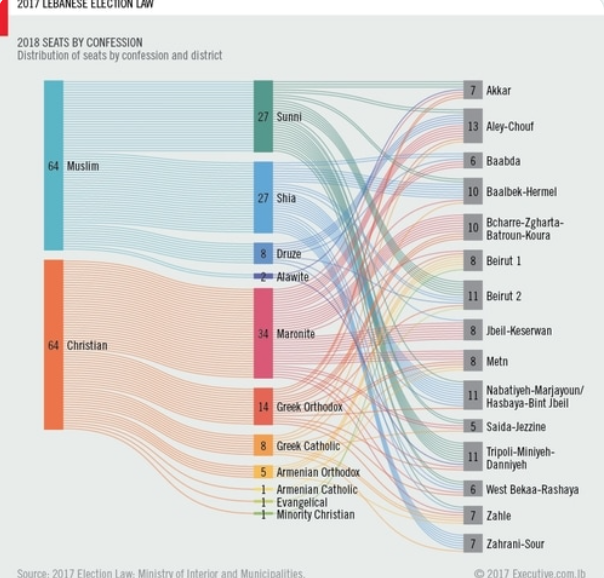
Static-Keep it simple
You should really think about the purpose of your messaging before getting too sophisicated in using data visualization tools. If your data less subject to change, perhaps you only need a simple bar graph as a static graphic.
RawGraphs
The is a great resource to help explore the various charts types and figure out what may work.
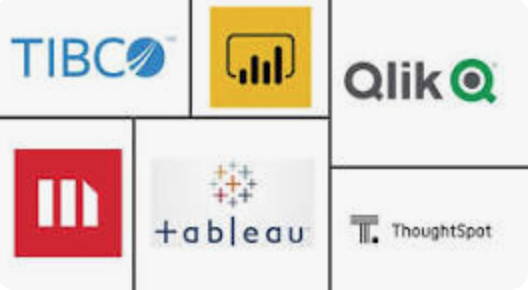
BI Tools
Software like Tableau and Microsoft BI have become popular because they enable less code depended users to organize, shape, create and present data typically in an enterprise setting.
D3js development
Open source tools like D3js have fostered a community of data centric developers. The latest tool, Observable Framework, allows you to create and publish your visualizations on a dedicated host
Why choose Viz-Data?
We believe we can help simplify the complex. Our services focus on bridging the implemention gap with our experience in Data Science techniques using Python scripting and the JavaScript eco-system concentrating on d3js and frameworks such as React, Nextjs and Angular.